Image Processing Notes: Summary
Published
Resizing, Rotating and Dithering Pictures: What Actually Matters
Chris Lomont, with Claude Fable 5.2
What this article is. The plain-language article in a pair on resizing, rotating and dithering pictures: what goes wrong, what it looks like, and what to do about it. No formulas. View the figures at 100% zoom, because a viewer that rescales them adds its own blur and patterns.
Related articles. Full treatment with mathematics and references: Image Sampling and Resampling . Longer checklist: Best Practices and Gotchas . Companion topics: sampling theory and where it stops (summary ); color spaces and HDR (summary ).
This is the short version of the image processing notes; for how and why they were written, see the introduction to the main article .
Contents
- 1. A picture is a grid of samples
- 2. Shrinking is averaging
- 3. Enlarging is guessing
- 4. There is no best method, but there are bad ones
- 5. Do each operation on the right brightness scale
- 6. Rounding needs noise
- 7. Numbers that claim to measure quality often do not
- 8. Practical rules
1. A picture is a grid of samples
A digital picture is a grid of numbers. Each number records how bright the scene was around one spot. Nothing in the file says what the picture looks like between the spots, and nothing says that a pixel is a little square. The squares appear when a program enlarges a picture in the crudest way; a different program could draw soft dots, or a smooth surface through the same numbers, and each would be an equally legitimate reading of the file.
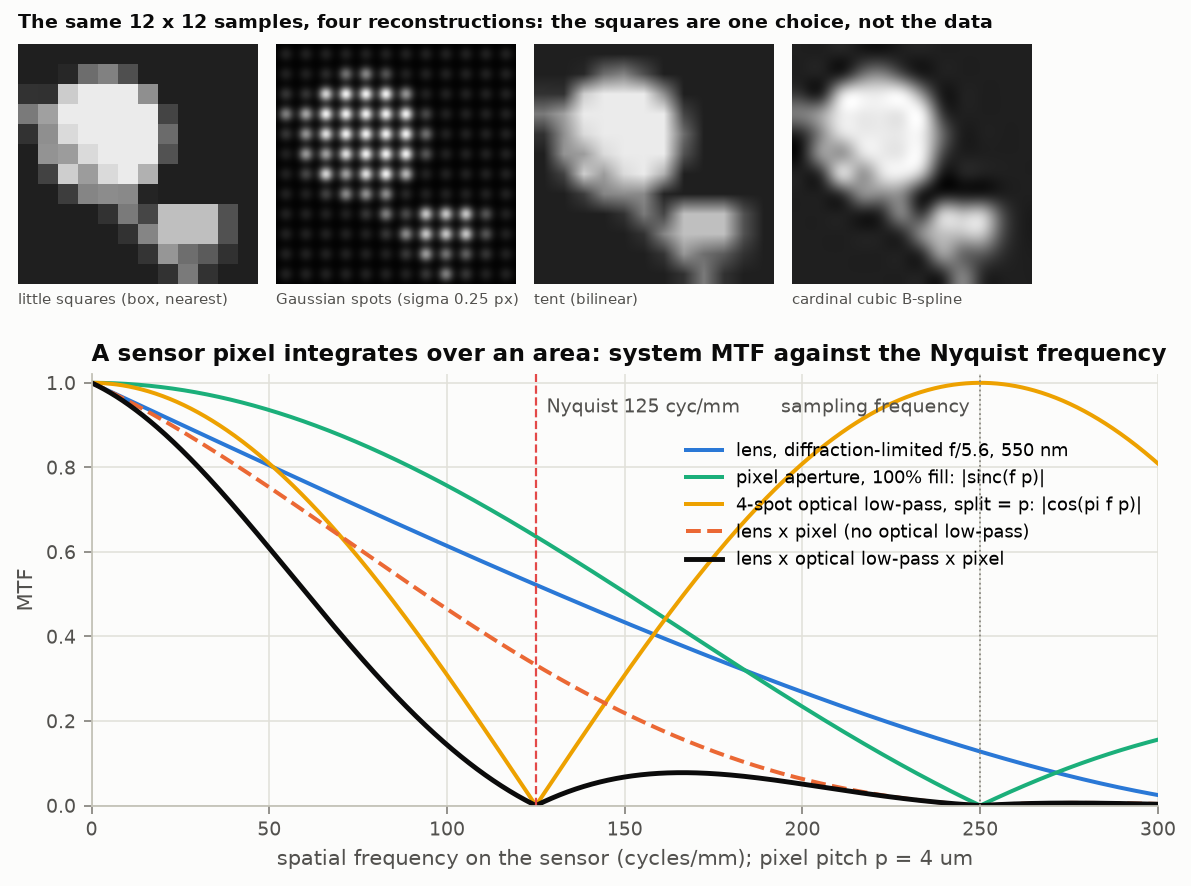
Figure 1. Left: the same 12 by 12 grid of numbers drawn as squares, as soft spots, with straight-line blending, and as a smooth curve. Right: how much fine detail a camera lens and sensor let through before the picture is sampled. Even at the finest detail the grid can hold, a third of the contrast is still there, and some detail finer than that leaks in as well.
This matters because almost everything done to a picture (shrinking, enlarging, rotating, straightening a perspective) needs values at places where there are no samples. The program has to decide what the picture is between the samples, and the decision is a choice, with consequences.
There is a classical theory for this, from telephone engineering: if a signal contains no detail finer than a certain limit, then samples spaced closely enough capture it perfectly, and there is one exact way to fill in between them. Pictures do not meet the condition. The edge of an object is infinitely sharp detail, and cameras and renderers do not remove all detail finer than the grid before sampling. So the exact theory is a guide, and the practical question becomes: which errors will we get, and which do we mind least?
2. Shrinking is averaging
When a picture is made smaller, each new pixel has to stand for a patch of many old pixels. The right value is an average over the patch. If a program instead picks one old pixel from each patch, fine detail does not disappear: it turns into false, coarse patterns (moiré on fabrics and brick walls, jagged edges, sparkle). This is called aliasing , and once it is in the picture nothing removes it.
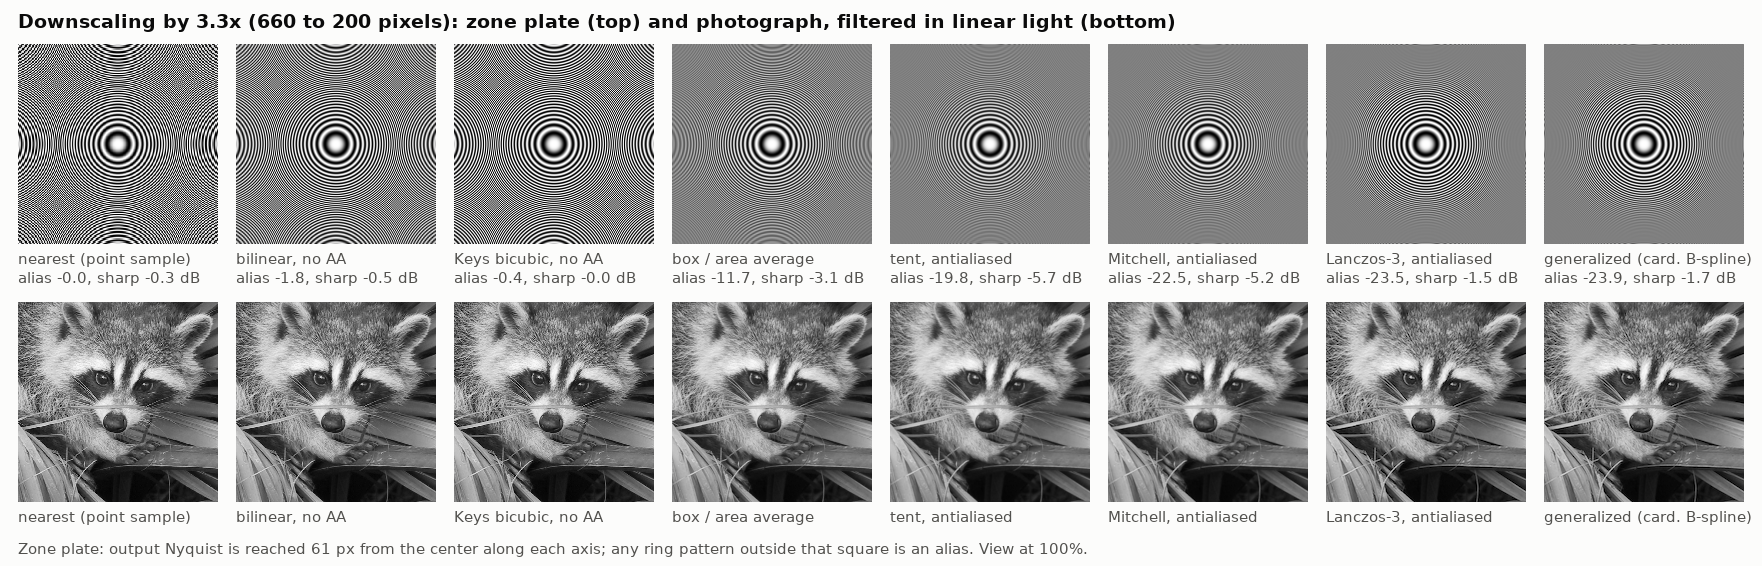
Figure 2. Shrinking by 3.3 times. Top: a pattern of rings that get finer toward the edge. Bottom: a photograph. The three methods on the left do not average over enough of the original, and the rings turn into false patterns. The methods on the right average properly; the last two keep the picture sharp as well.
Two things about the figure are worth knowing. First, the methods labeled “bilinear ” and “bicubic ” on the left are what several widely used programming libraries do by default when asked to shrink a picture: they look at only two or four neighboring pixels however much they are shrinking by. They are nearly as bad as picking single pixels. Second, a plain average over each patch (the “box”) is safe but not best: it lets some false pattern through and softens the picture. A weighted average that reaches a little further, with small negative weights at its edges, removes more of the false pattern and keeps more sharpness.
3. Enlarging is guessing
Making a picture bigger needs values between the samples, and there is no information there. Every method is a guess, and no method can add real detail. What the methods differ in is the character of the guess.
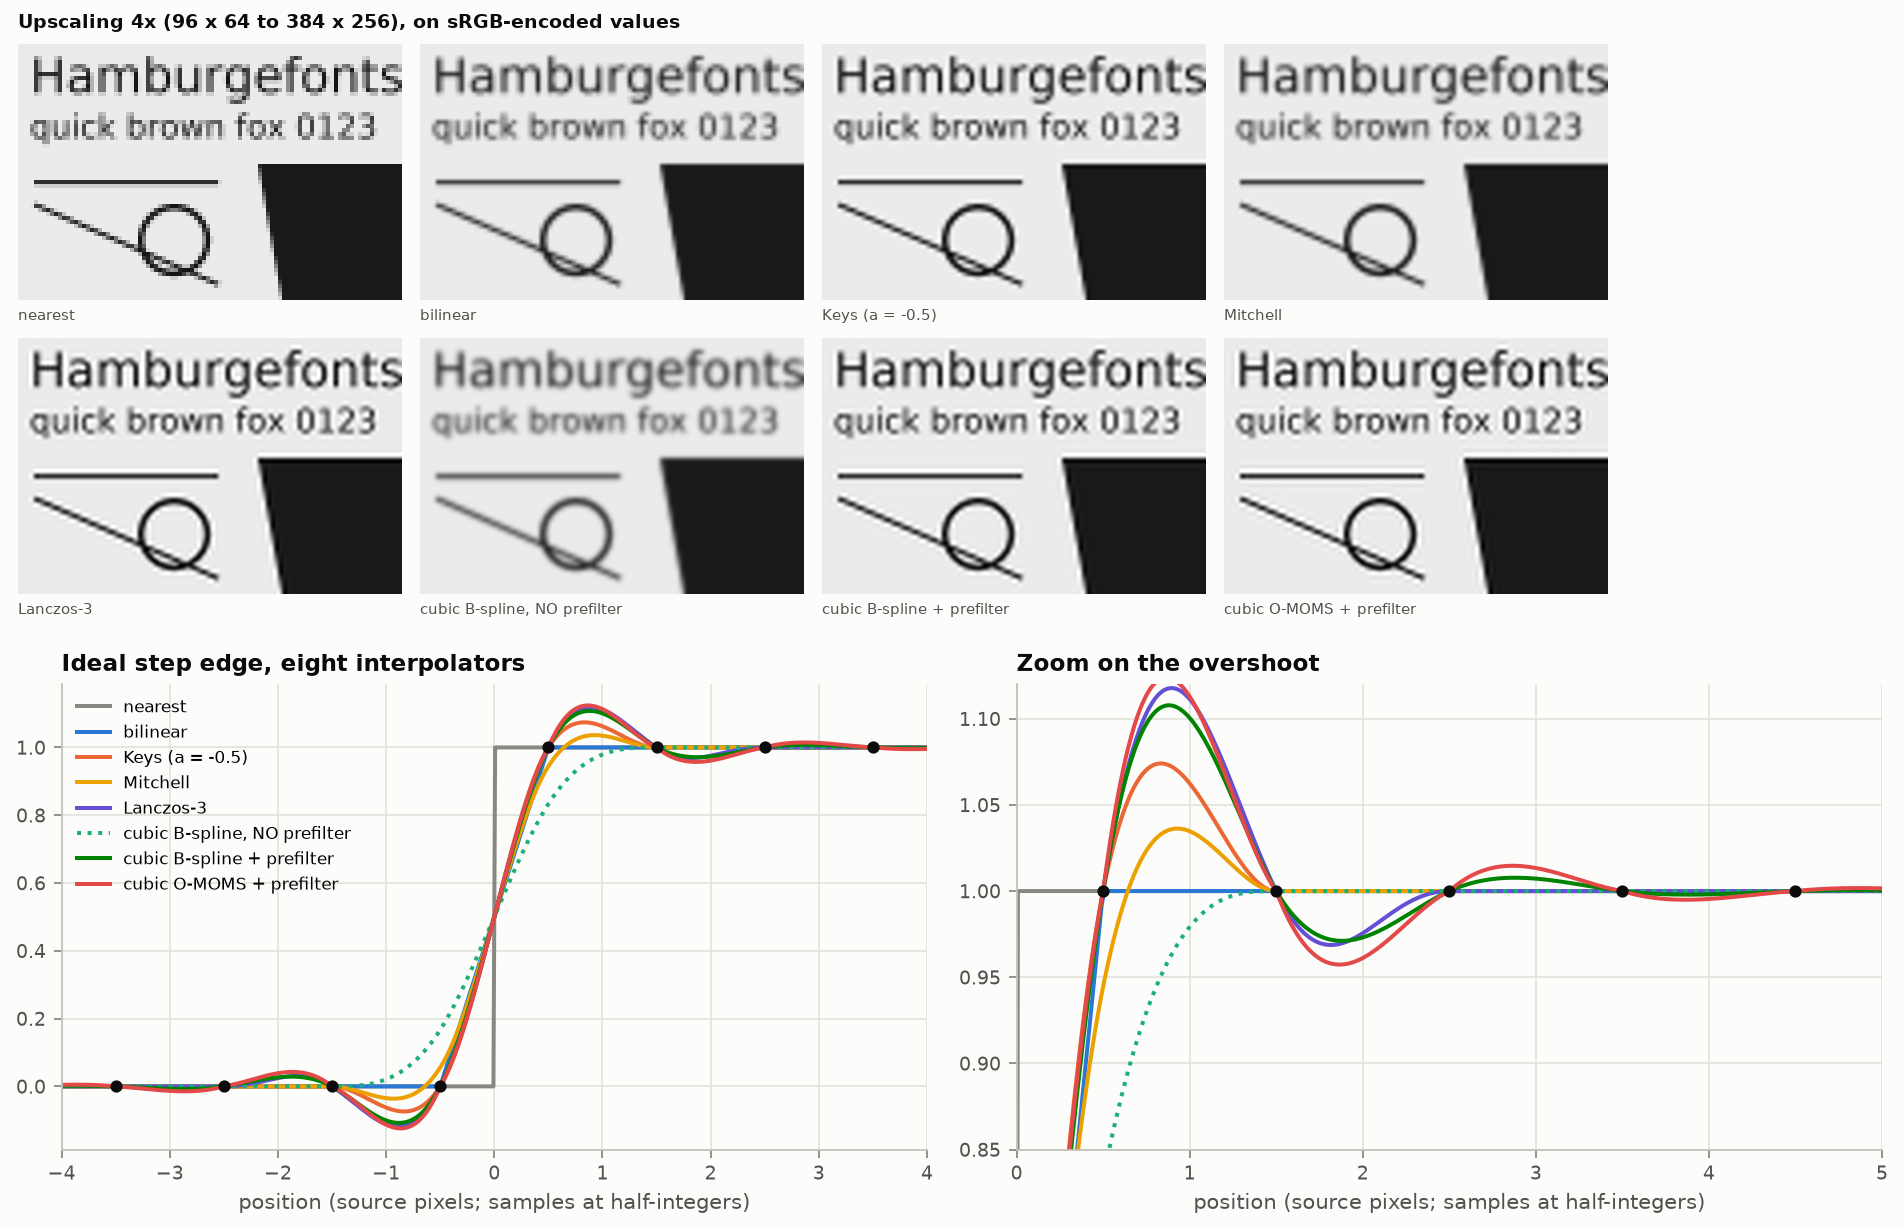
Figure 3. A small test image enlarged four times. Copying the nearest pixel gives blocks. Blending in straight lines is smooth but soft. The sharper methods keep edges crisp but add a faint bright and dark fringe along them (ringing). One method, in the bottom row, is much blurrier than the rest: it is a good method used without a preparation step it needs.
The trade is simple to state. A method that never invents a value outside the range of its neighbors cannot produce fringes, and must blur. A method that keeps edges sharp must overshoot: a little brighter than the bright side just before the edge, a little darker than the dark side just after. The sharpest practical methods overshoot by about a tenth of the brightness step. On photographs this is rarely noticed. On text and line drawings it is.
4. There is no best method, but there are bad ones
People have proposed hundreds of formulas for filling in between samples. A few findings hold up across the published tests and the experiments made for this article.
- A cheap preparation step beats a more elaborate formula. The best family of methods (called splines) first runs one quick pass over the whole picture to convert the pixel values into a different set of numbers, and then blends four of those numbers for each new pixel. The result is clearly better than the popular “bicubic” method, which also blends four numbers but skips the preparation. The cost is nearly the same.
- Skipping the preparation step turns that good method into the worst one. This mistake is common enough that the method has an undeserved reputation for blurring.
- Differences show when operations are repeated. Rotate a picture once and most decent methods look alike. Rotate it fifteen times, as an editing session or an alignment program might, and the weaker methods have visibly smeared it while the best have not.
- The ranking depends on the picture. Smooth, cleanly captured pictures reward the mathematically most accurate methods. Pictures full of hard edges, or pictures that were badly shrunk earlier, can reverse the order.
The last point produced one of the surprises of this work. On a test pattern that already contained false detail, the blurriest ordinary method got the best score from the standard error measure, though it plainly looked worst. The sharper methods reproduced the faulty input faithfully and were marked down for it. That is a warning about scores, taken up in section 7.
5. Do each operation on the right brightness scale
This is the least known of the main ideas and the one that most often goes wrong.
The numbers in an ordinary picture file are not proportional to light. They are stored on a compressed scale, chosen so that equal steps in the numbers look like roughly equal steps in brightness to a person. On that scale the middle value, 128 out of 255, stands for only about a fifth of the light of full white, though it looks like a middle gray.
Now consider two kinds of operation.
Averaging light. Shrinking a picture, blurring it, and blending a partly covered pixel at the edge of a letter all imitate something physical: light from several places mixing together, as it does in a camera, or in the eye when you stand far away. Light adds up as light. So these operations must be done on numbers proportional to light: convert, average, convert back. If the stored numbers are averaged directly, the result is too dark, and the error is biggest exactly where there is fine detail.
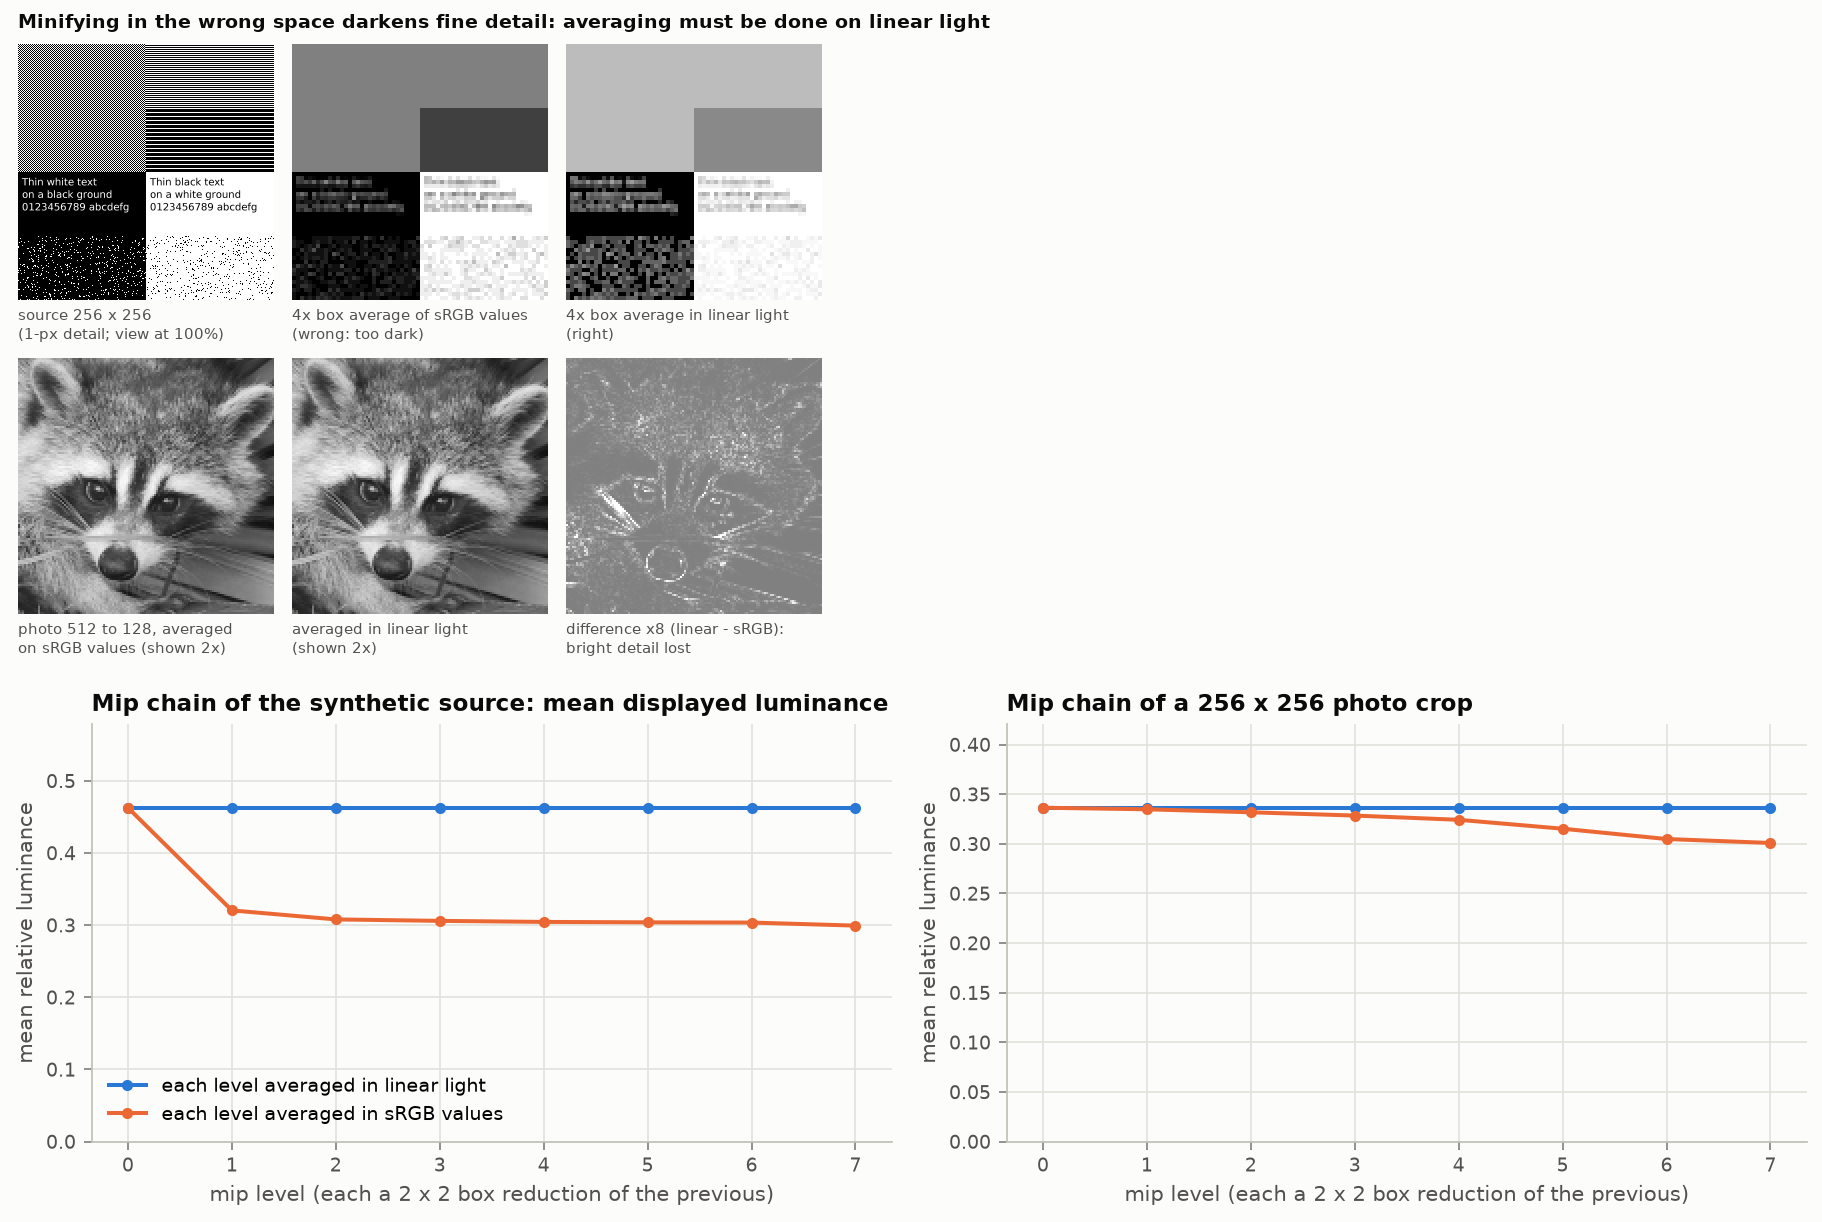
Figure 4. Top: a pattern of fine black and white detail, shrunk four times by averaging the stored numbers (middle) and by averaging light (right). A fine checkerboard should become a gray that reflects half the light; averaging the stored numbers gives a gray with only a fifth of the light. Fine white text on black loses most of its brightness. Bottom: on a photograph the average difference is small, which is why this mistake goes unnoticed, but highlights and fine bright hairs are visibly dimmed.
Guessing between samples. Enlarging a picture is not imitating anything physical. It is a guess that a person will look at. Here the compressed, perception-like scale is the better place to work, for two reasons. A value halfway between two samples should look halfway between them, and it does on the perceptual scale. And the fringes that sharp methods add come out the same visual size on the dark side and the bright side. Done on light values instead, the dark fringe drops to pure black, a hard dark outline, while the bright fringe is nearly invisible, and bright features look fatter than dark ones.
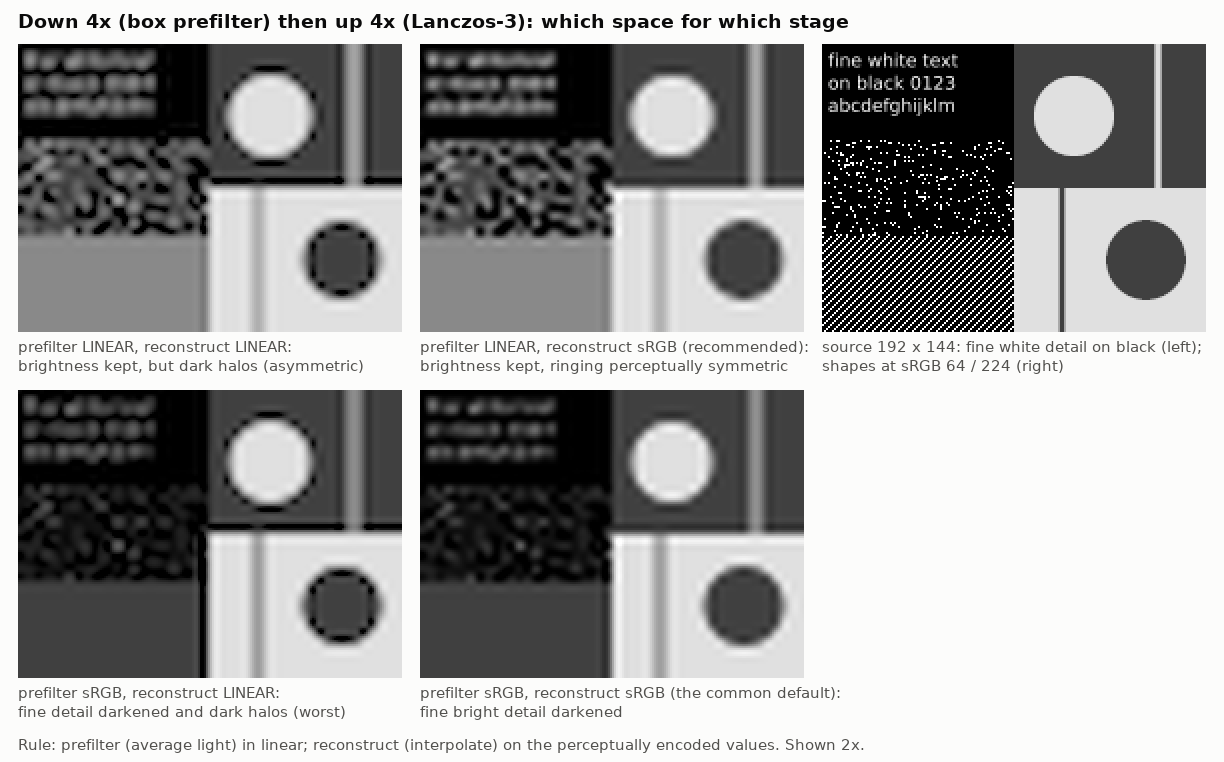
Figure 5. A picture shrunk four times and enlarged again, with each step done on light values or on stored values. Top row: shrinking on light values keeps the fine white detail at its true brightness. Bottom row: shrinking on stored values dims it. Left column: enlarging on light values puts black outlines around bright shapes. Right column: enlarging on stored values gives even, mild fringes. The top right picture follows the rule: average on the light scale, guess on the perceptual scale.
This two-part rule comes from a short passage in a 2014 monograph by Diego Nehab and Hugues Hoppe. The first half (average on light values) is as solid as anything in this subject. The second half (guess on the perceptual scale) is a good rule of thumb for clear enlargements; for small adjustments such as a slight rotation, on a screen with very fine pixels, the eye blends neighboring pixels anyway and the argument for light values comes back. Many other sources simply say “always use light values”, which is right for the first kind of operation and can give dark outlines in the second.
6. Rounding needs noise
A picture file has a limited number of brightness levels, and some displays and printers have very few: black and white only, or six inks. Rounding every pixel to the nearest available level makes smooth gradients break into bands, and with only two levels it destroys the picture.
The cure is counter-intuitive: add a little noise before rounding. With the right kind of noise, each pixel rounds up or down at random in just the proportion needed, so that the average over a neighborhood is the correct shade. The bands are replaced by a fine grain. Two refinements matter.
- The pattern of the grain. The eye is good at seeing coarse blotches and poor at seeing very fine, even speckle. So the noise should have no coarse component. Patterns designed this way are called blue noise . A related method, error diffusion , rounds each pixel and passes the rounding error on to its neighbors that have not been processed yet, which produces a similar fine grain automatically.
- The benefit depends on how far away you stand. On a coarse display seen close up, fine-grained and blotchy noise are about equally visible. On a fine display, or from further away, the fine-grained kind is far less visible. The total amount of error is the same in both cases. These methods do not remove error; they move it to where the eye does not look.
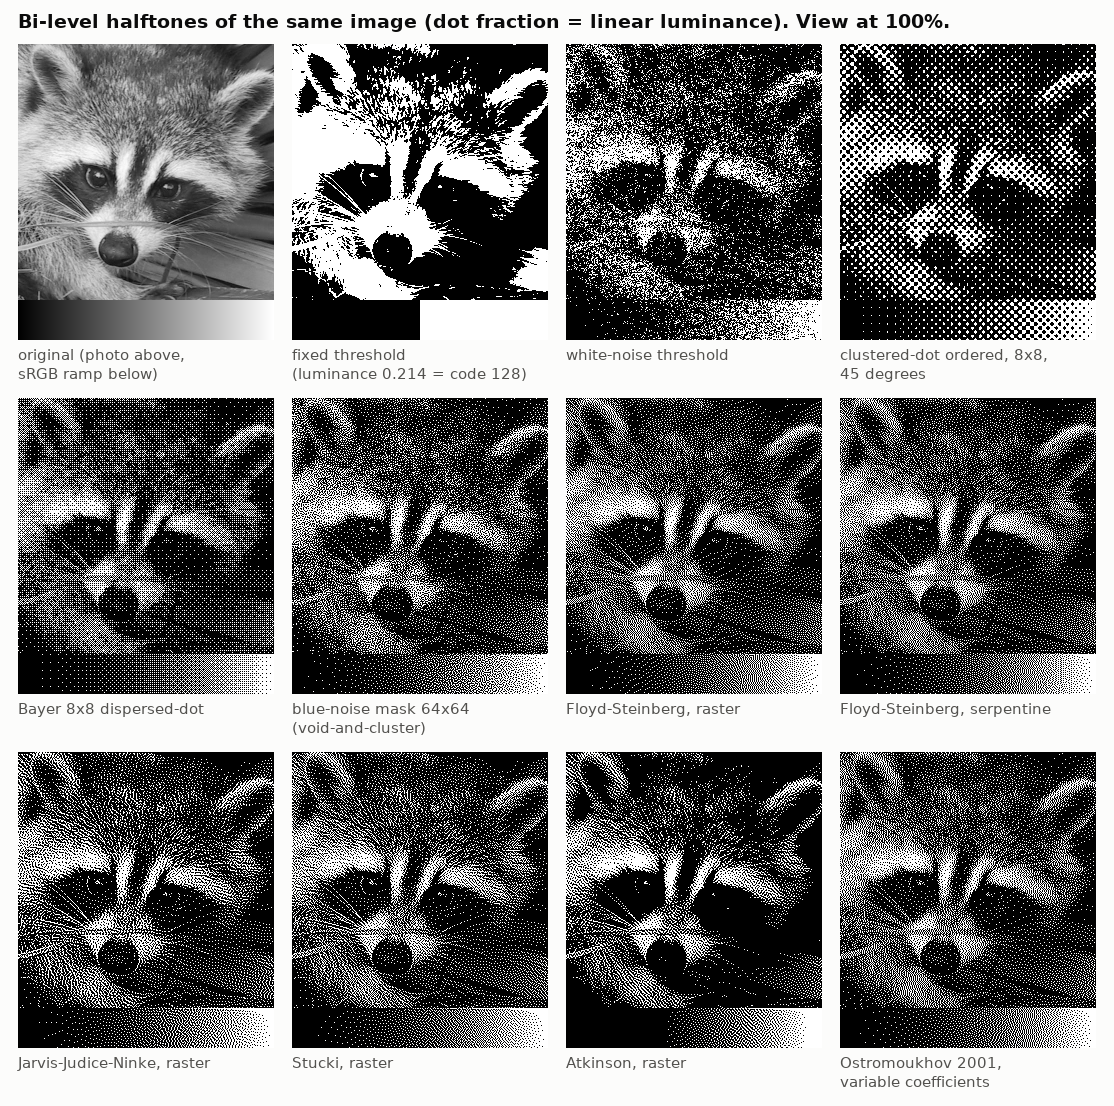
Figure 6. A photograph reproduced with only black and white dots. A fixed cut-off loses everything in the shadows. Random noise gives the right shades but is coarse and grainy. Regular patterns show a visible texture. Blue-noise patterns and the error-diffusion methods in the lower rows give fine, even grain. Measured error is almost the same for all of them; what differs is where the error sits.
The brightness scale matters here too, in the same way as in section 5. A pattern of dots makes a shade because the eye averages the light from the dots. So the proportion of white dots must match the light value, not the stored number.
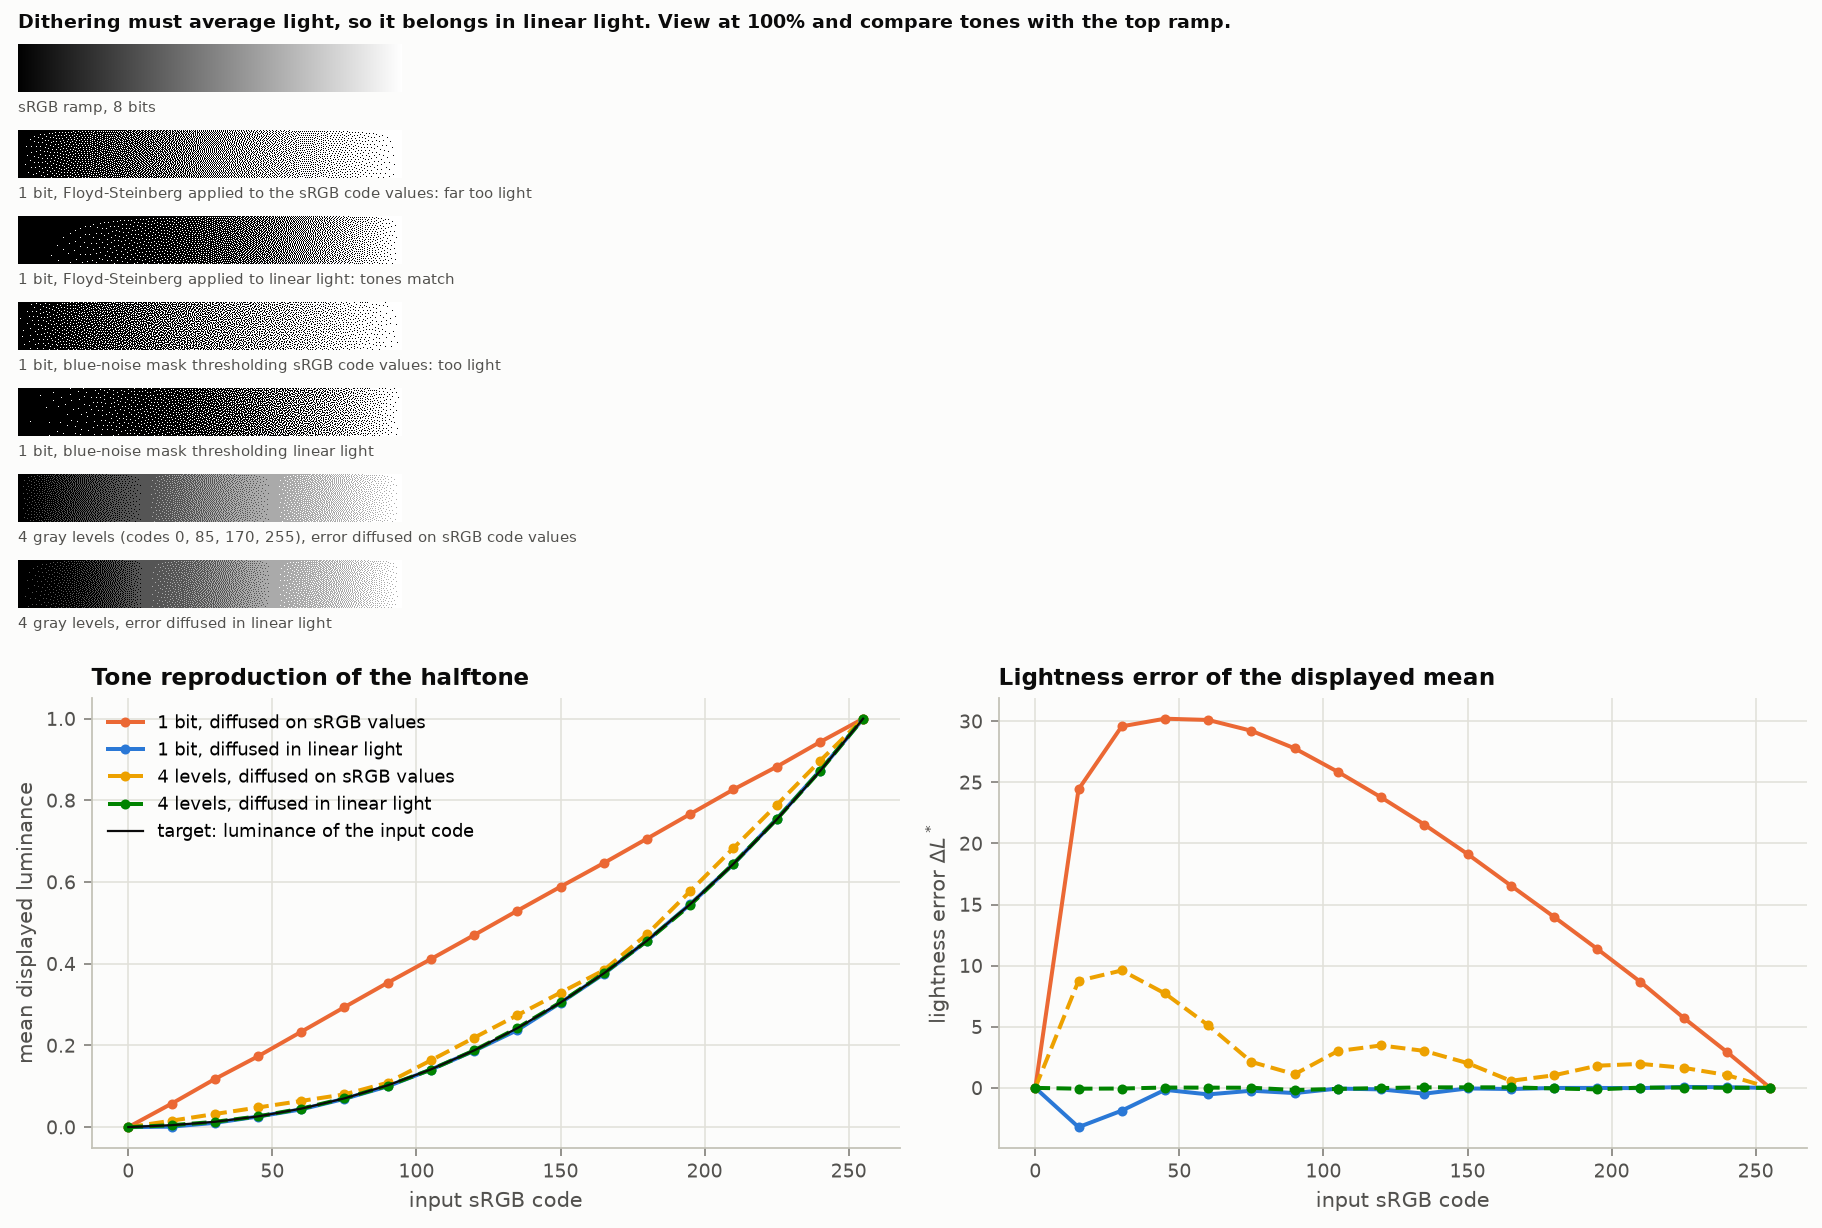
Figure 7. A smooth ramp from black to white reproduced with dots. Computed from the stored numbers, the result is far too light across the whole middle of the range: a shade that should have one white dot in forty gets one in six. Computed from light values, the shades are right.
For color pictures and small sets of inks, as on color electronic-paper displays, the same rule holds, with extra difficulties: the available colors are few and dull, many picture colors cannot be made by mixing them at all, and neighboring dots affect each other. One experiment here gave a cautionary result. Choosing, pixel by pixel, the ink that is “perceptually closest” to the picture color, without passing the leftover error on, turned a gray animal bright red, because red happened to be the ink closest in lightness. A perception-based measure of difference is the right way to judge a result and the wrong thing to steer by one pixel at a time.
7. Numbers that claim to measure quality often do not
Two scores are used almost everywhere to say how close a processed picture is to an original. One, called PSNR , adds up the squared differences pixel by pixel. The other, SSIM , compares local brightness, contrast and pattern. Both are useful for narrow jobs and both are regularly mistaken for measures of what a person would see.
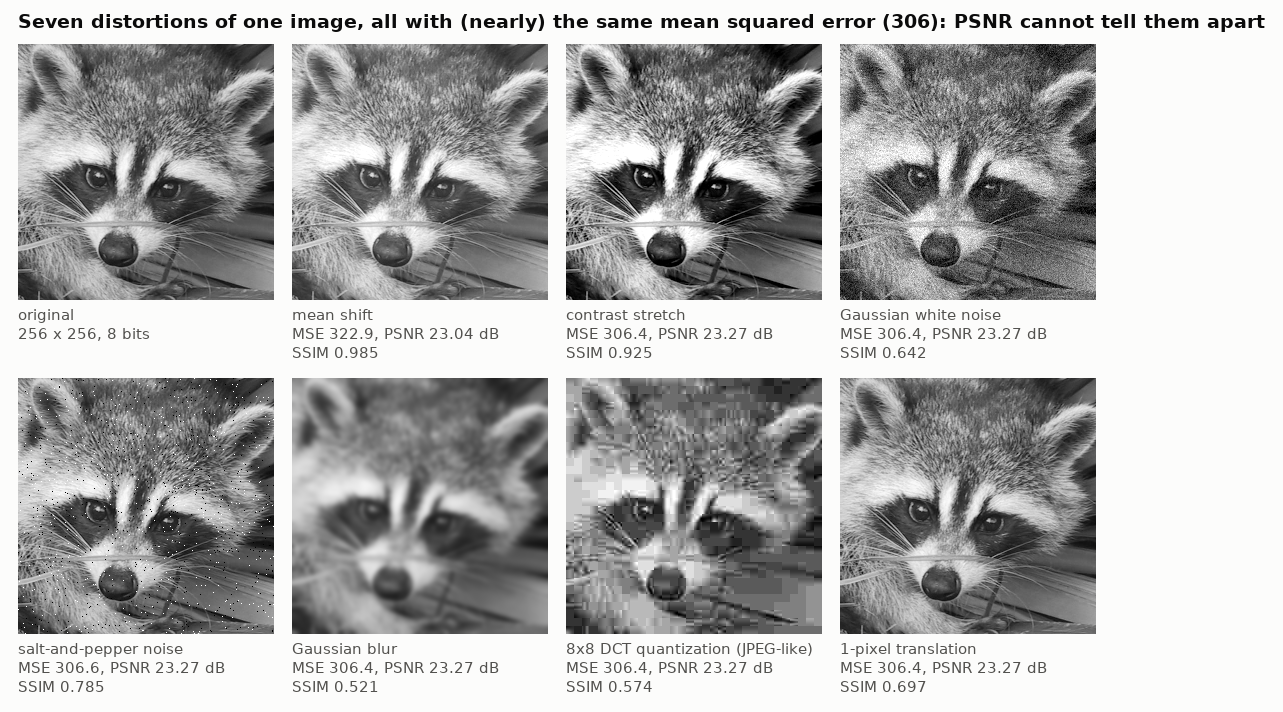
Figure 8. Seven damaged versions of one picture, all adjusted to have exactly the same pixel-by-pixel error. A slight overall brightening and a contrast change are barely noticeable; blur and blocky compression are obvious. The first score rates all seven the same. The second score separates them better, but it also marks down, heavily, a copy that has merely been moved sideways by one pixel, which nobody would notice.
What goes wrong, briefly:
- They do not know how the picture is viewed. Whether an error is visible depends on its size on the retina, which depends on the screen and the distance. The same file can be flawless on a phone and visibly flawed on a large monitor. Neither score has any input for this.
- They punish tiny shifts. Moving a picture a quarter of a pixel, far too little to see, is scored like serious damage.
- They reward blur. A soft guess that is a little wrong everywhere scores better than a crisp guess that is right in most places and wrong at a few edges. Methods tuned to these scores produce soft pictures.
- They depend on the brightness scale the numbers happen to be on; the ranking of two pictures can flip when the scale is changed.
- The second score is not much better than the first at agreeing with people: in one large test of which of two damaged pictures people judged closer to an original, both agreed with the human choice about 63 times in 100, while people agreed with each other about 74 times in 100.
Better tools exist. Some compare pictures using the internal features of image-recognition networks, and agree with people more often, though they can be fooled and they accept invented detail as long as it looks plausible. Others are built from measurements of human vision and ask for the screen size, brightness and viewing distance; these come closest to predicting whether a difference can be seen. None is reliable enough to replace looking, and there is a mathematical result that explains part of why: when a lot of information is missing, the answer with the smallest average error is a blurry average of all the possibilities, and any answer that looks like a real picture must accept more error. Low error and natural appearance pull in different directions.
A good deal is known about how sensitive the eye is to simple patterns of different fineness, brightness and color. Much less is known about how to turn that into a single judgment of a complicated picture, and very few experiments have asked people directly which resizing method they prefer.
8. Practical rules
- Shrinking: make sure the program averages over the whole area each new pixel covers; many defaults do not. Do the averaging on light values, not on the stored numbers.
- Enlarging: use a spline method with its preparation step, or a Lanczos filter (a sharp filter offered by most image programs); accept slight fringes on photographs; use a gentler method for text. Work on the stored (perception-like) numbers.
- Rotating and repeated edits: combine the steps and resample once if you can. If you cannot, use the best method available and keep full precision between steps.
- Blur, transparency, soft edges, text edges: these mix light; do them on light values.
- Never use a spline method without its preparation step. If a “cubic B-spline ” looks blurry, that is what happened.
- Reducing the number of levels: add fine-grained noise before rounding. For a handful of levels or inks, compute the dots from light values.
- Check where pixel centers are. Programs disagree by half a pixel, and the disagreement shows up as a small shift or stretch that spoils comparisons.
- Judging results: line the pictures up exactly, compare like with like, say what scale and what score were used, and look at the pictures at full size on the screen they are meant for. Treat any single quality number as a rough screen.
Comments