Color and HDR Notes: Summary
Published
Color and HDR: What the Numbers in a Picture Really Mean
Chris Lomont, with Claude Fable 5.2
What this article is. The general-audience article in a pair on color and HDR: what the numbers in a picture mean, why they go wrong, and how to recognize the errors. For programmers, photographers and curious readers.
Related articles. Full treatment with references: Color Spaces and HDR . Lookup tables: Reference Tables . Error guide: Best Practices and Gotchas . Companion topics: image resampling, dithering and quality metrics (summary ); sampling theory and where it stops (summary ).
This is the short version of the color and HDR notes; for how and why they were written, see the introduction to the main article .
Contents
- Three numbers and a lot of assumptions
- Why the numbers are not proportional to light
- What HDR is
- “Stops”: one word, five meanings
- Brightness is not what the meter says
- A screen’s colors are a solid, not a triangle
- Your eyes are not the standard eyes
- HDR photos that carry two pictures
- Where this is going
- Rules of thumb
Three numbers and a lot of assumptions
Every pixel on a screen is three numbers: how much red, green and blue. That sounds complete. It is not. The numbers only become a color once you know which red, green and blue lights are meant, how the numbers translate into brightness, and what counts as black and white. Files and video streams are supposed to carry labels that say so. The labels get lost, ignored or guessed all the time, and when that happens the picture comes out wrong in a recognizable way.
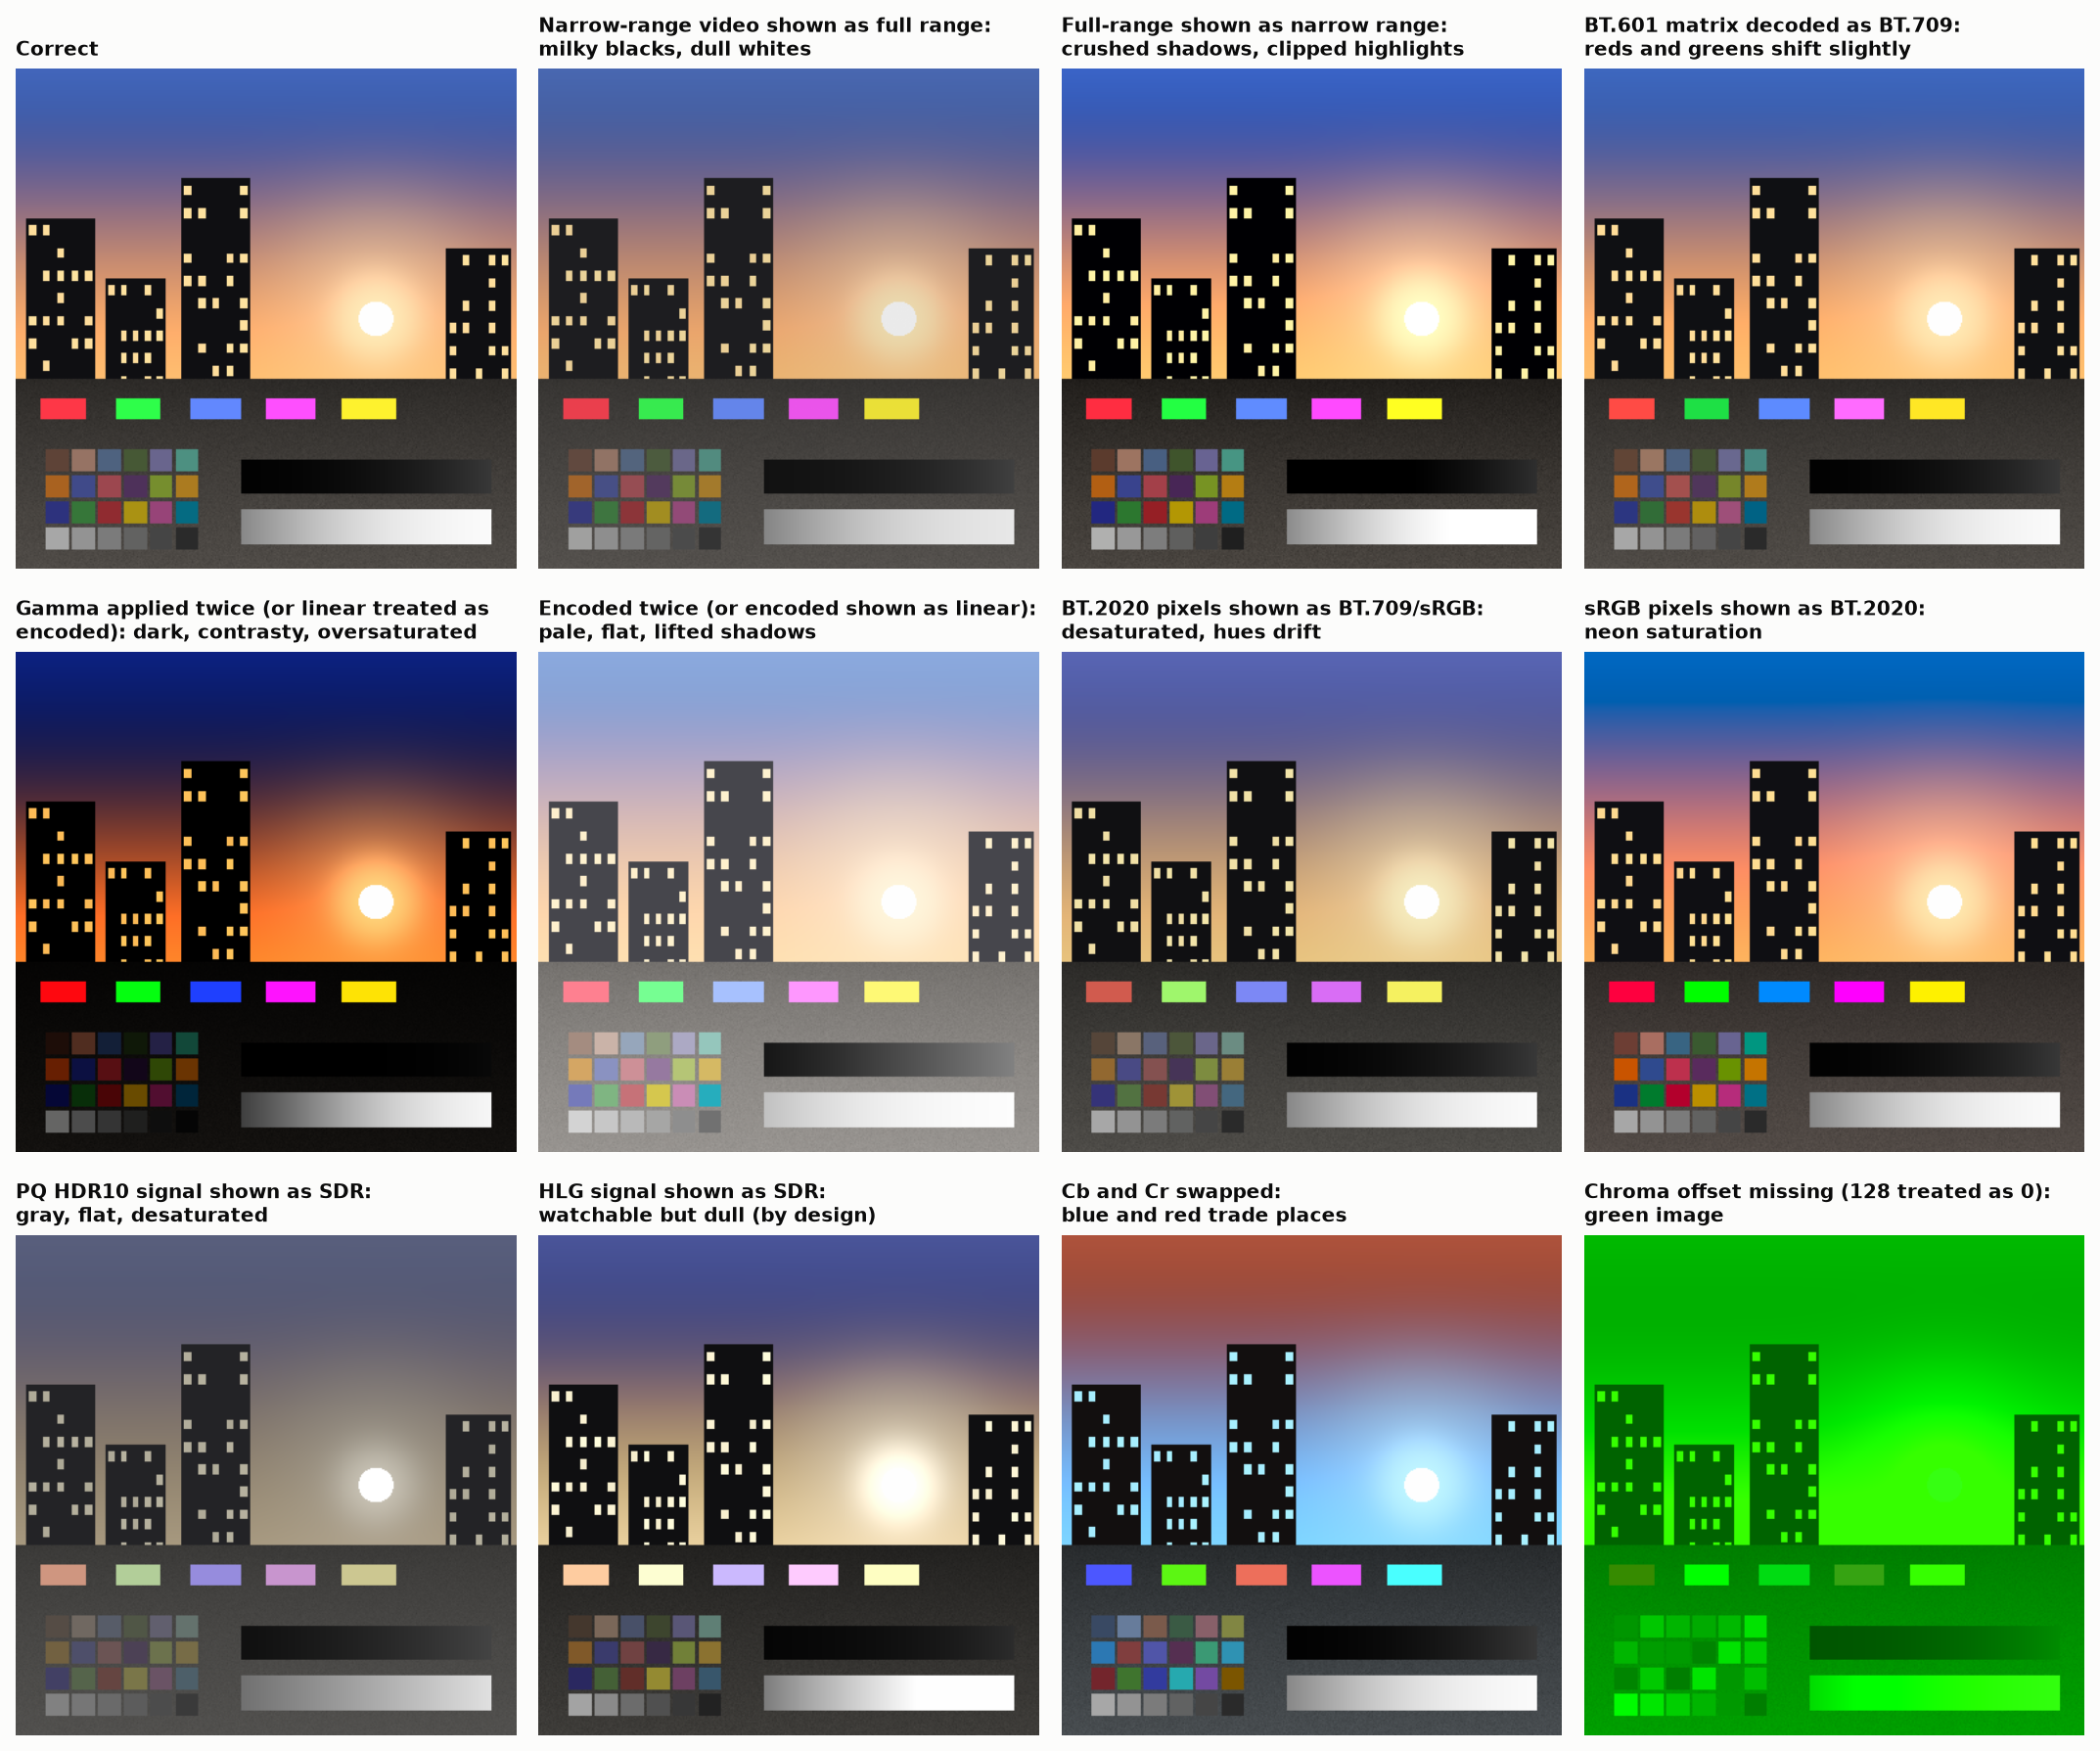
One correct picture (top left) and eleven common mistakes. Washed out, crushed, gray, neon or green: each look points to a specific mislabeling.
Most color problems are not subtle science. They are unit errors, like mixing up miles and kilometers.
Why the numbers are not proportional to light
If the number 100 gave half the light of 200, most of the available numbers would be spent on bright tones the eye can barely tell apart, and the shadows would break into visible steps. So image formats bend the scale: numbers are spread evenly by how they look. This bending is called gamma for ordinary pictures, and PQ or HLG for HDR.
The catch: math on bent numbers gives wrong light. Blending red into green using the stored numbers puts a dark band in the middle. Software has to straighten the numbers, do the math, and bend them back.
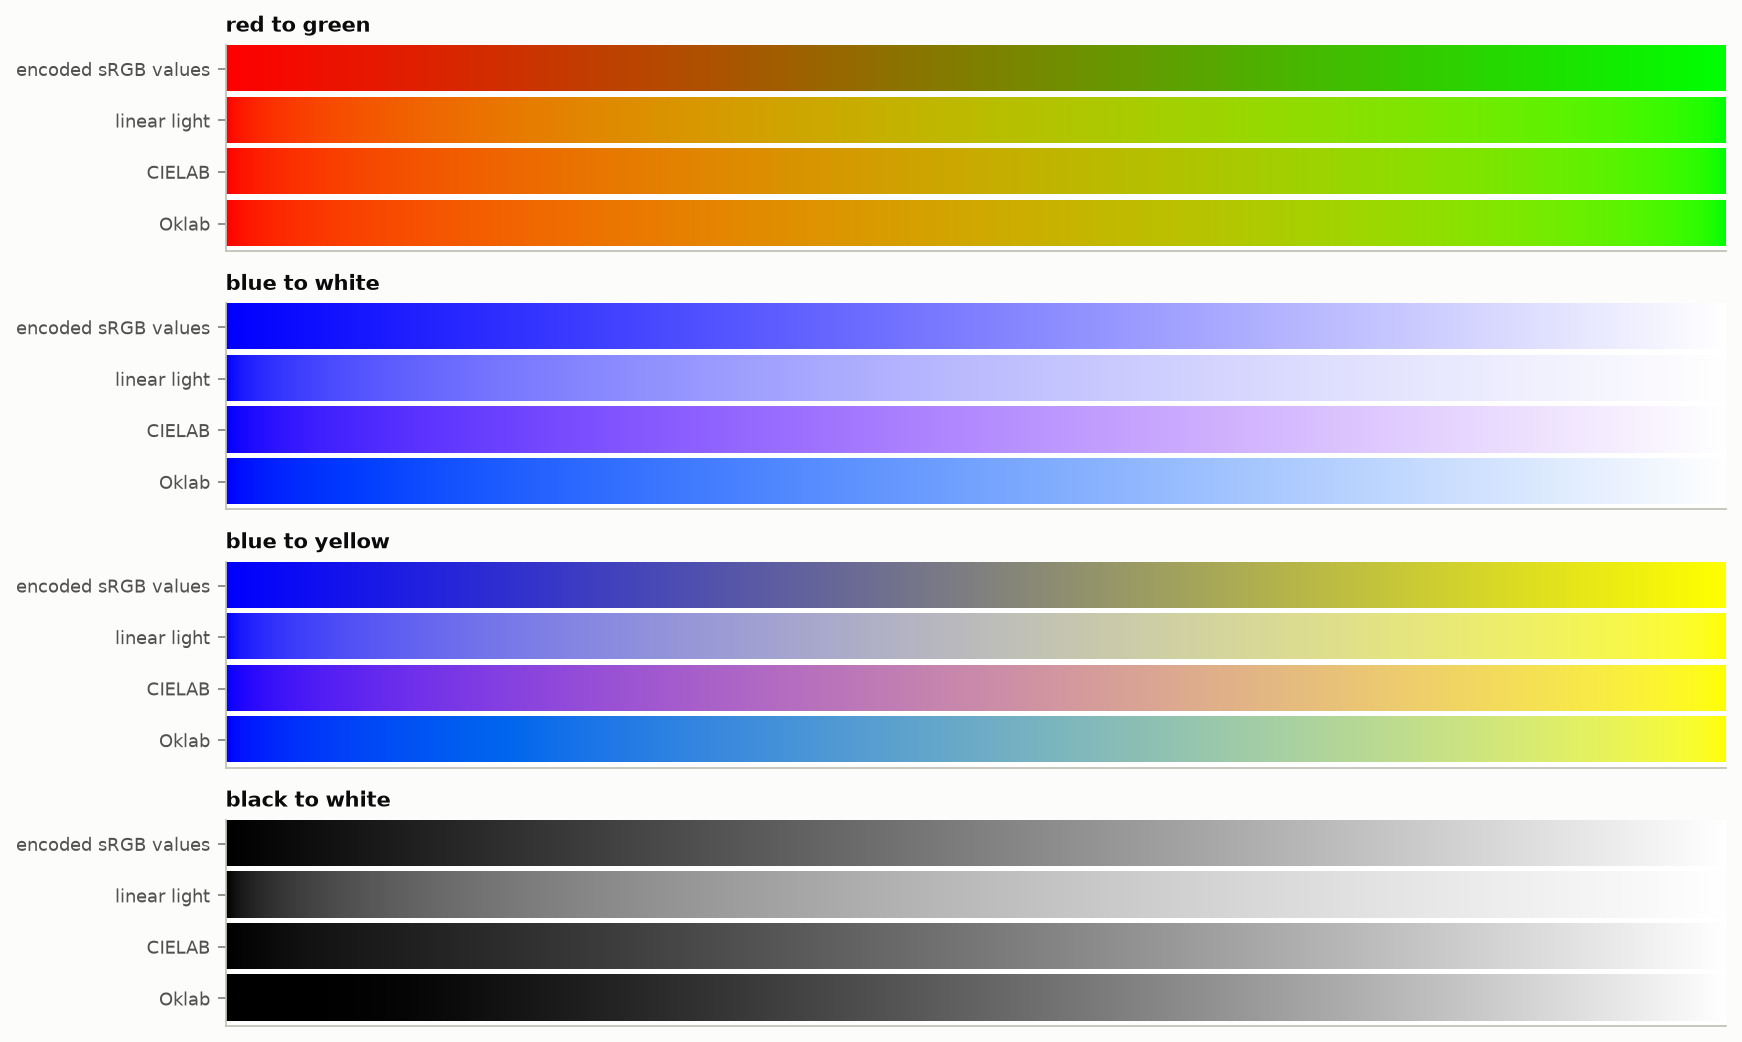
The same blends done four ways. The top strip in each group uses the stored numbers directly, and the middle of red-to-green goes dark.
What HDR is
HDR (high dynamic range ) pictures can hold both deeper shadows and much brighter highlights than ordinary ones: a sunset where the sun really is hundreds of times brighter than the buildings. It is less about making everything brighter and more about letting small bright things (lamps, reflections, the sky) be as bright as they should be while the rest stays normal.
HDR needs three things at once: a screen that can get brighter and darker, a number scale designed for that bigger range, and more steps on the scale so smooth skies do not show stripes.
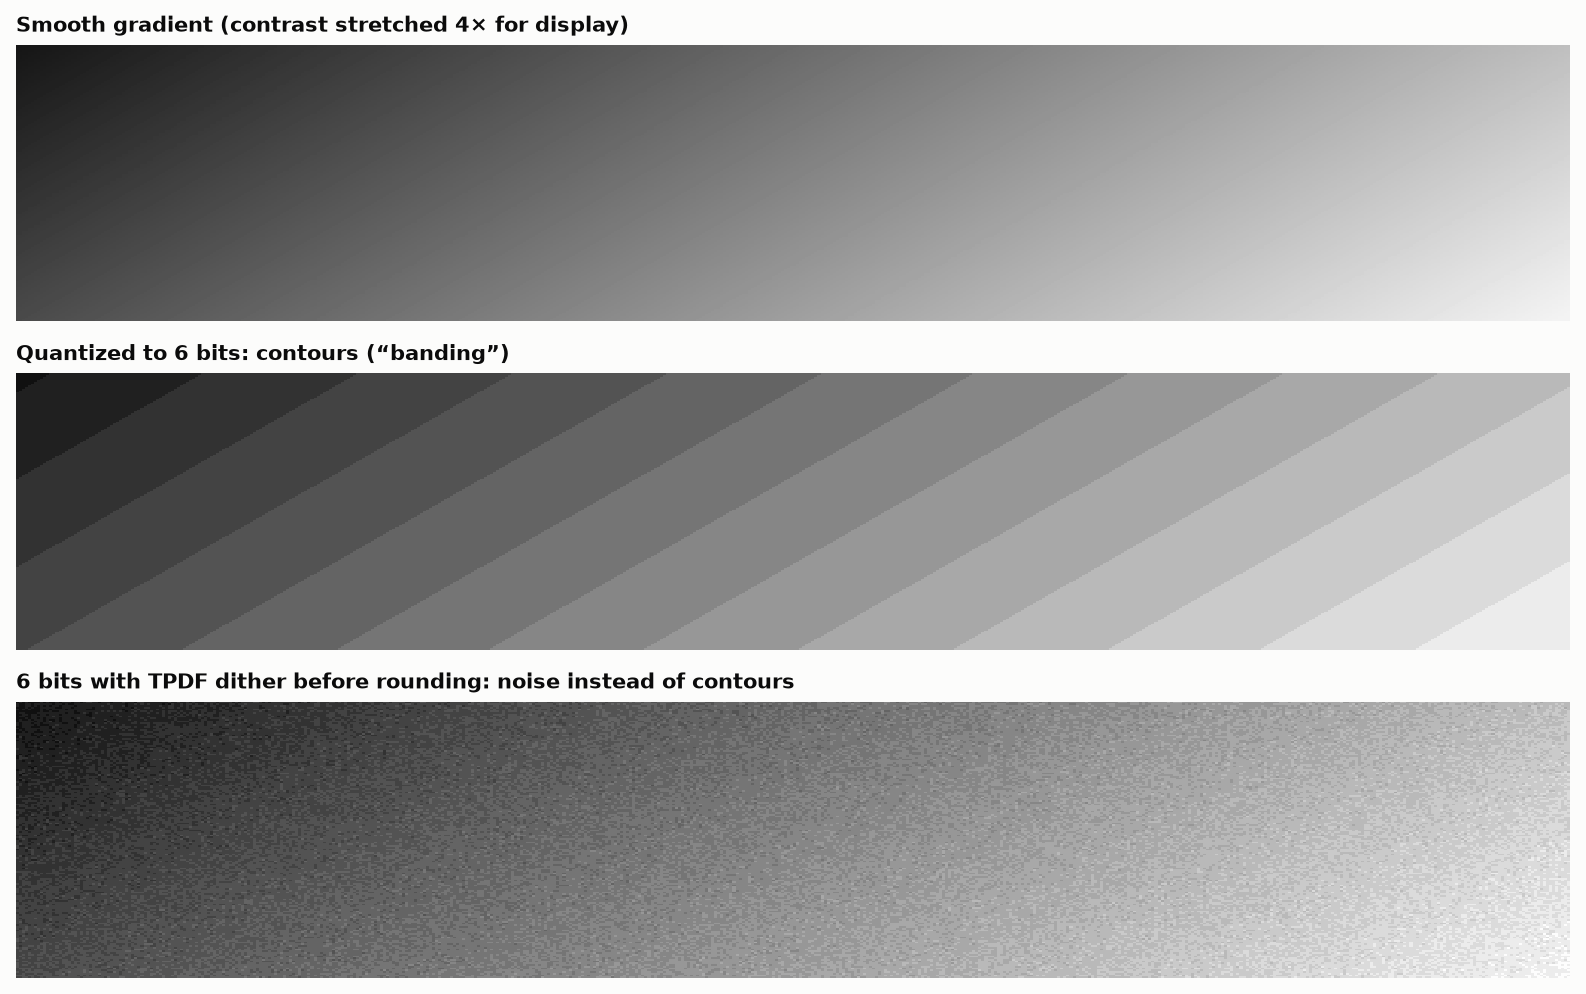
Too few steps turn a smooth gradient into stripes (middle). Adding a little noise before rounding hides them (bottom).
“Stops”: one word, five meanings
Photographers measure brightness ranges in stops: each stop is a doubling. Ten stops is about a thousand to one. The word is used for at least five different things, which is why claims never seem to agree:
- how much brighter the brightest part of a scene is than the darkest;
- what a camera sensor can capture, which depends on how much noise you accept in the shadows;
- how far apart the smallest and largest numbers in a file format are;
- how much of that range is smooth enough to use;
- how far above or below “normal” exposure something sits.
The same ordinary 8-bit picture is “12 stops”, “6 stops” or “3 stops” depending on which is meant. A camera advertised at 15 stops and one advertised at 12 may be the same camera measured two ways.
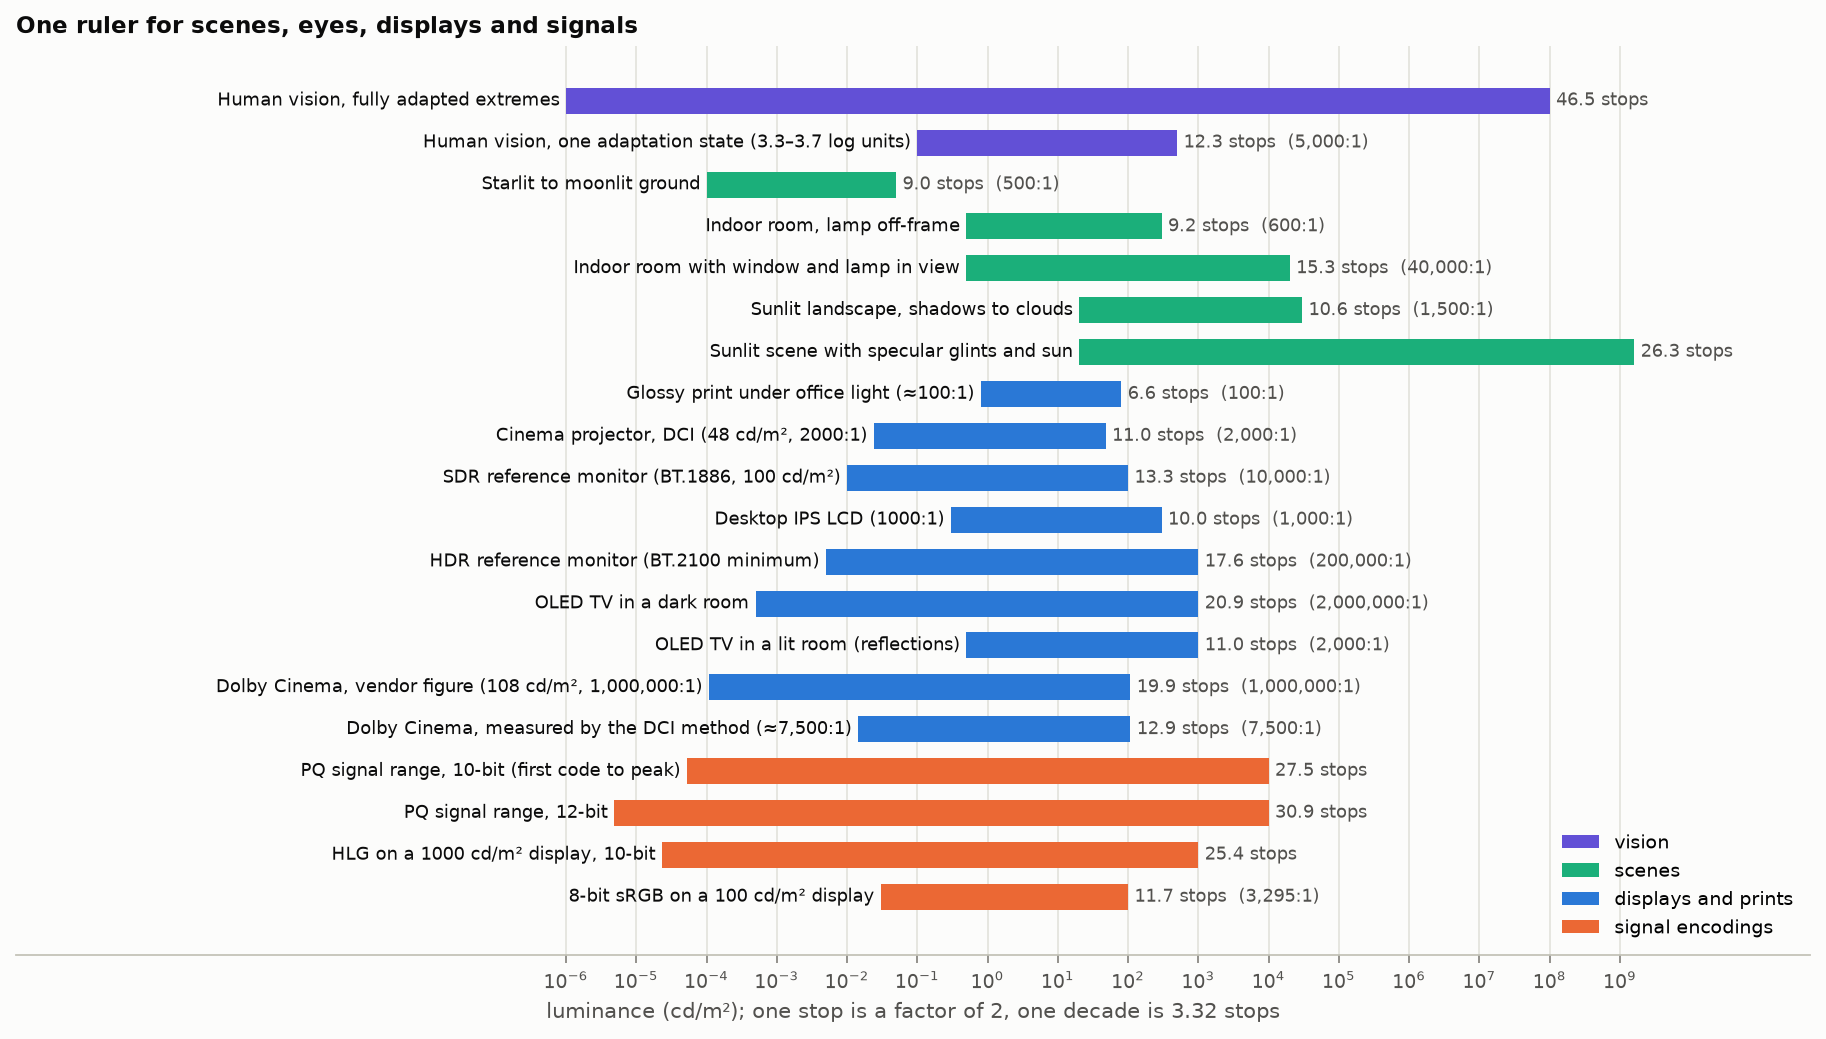
Scenes, eyes, screens and file formats on one scale. A TV in a lit room has far less range than its specification says, because the room reflects off the screen.
A good habit: never accept a number of stops without asking “measured how?”
Brightness is not what the meter says
Screens are measured in nits, a unit built on how sensitive the eye is to each color when detecting flicker. It is not the same as how bright something looks. A saturated red or blue looks brighter than a gray patch that a meter says is identical.
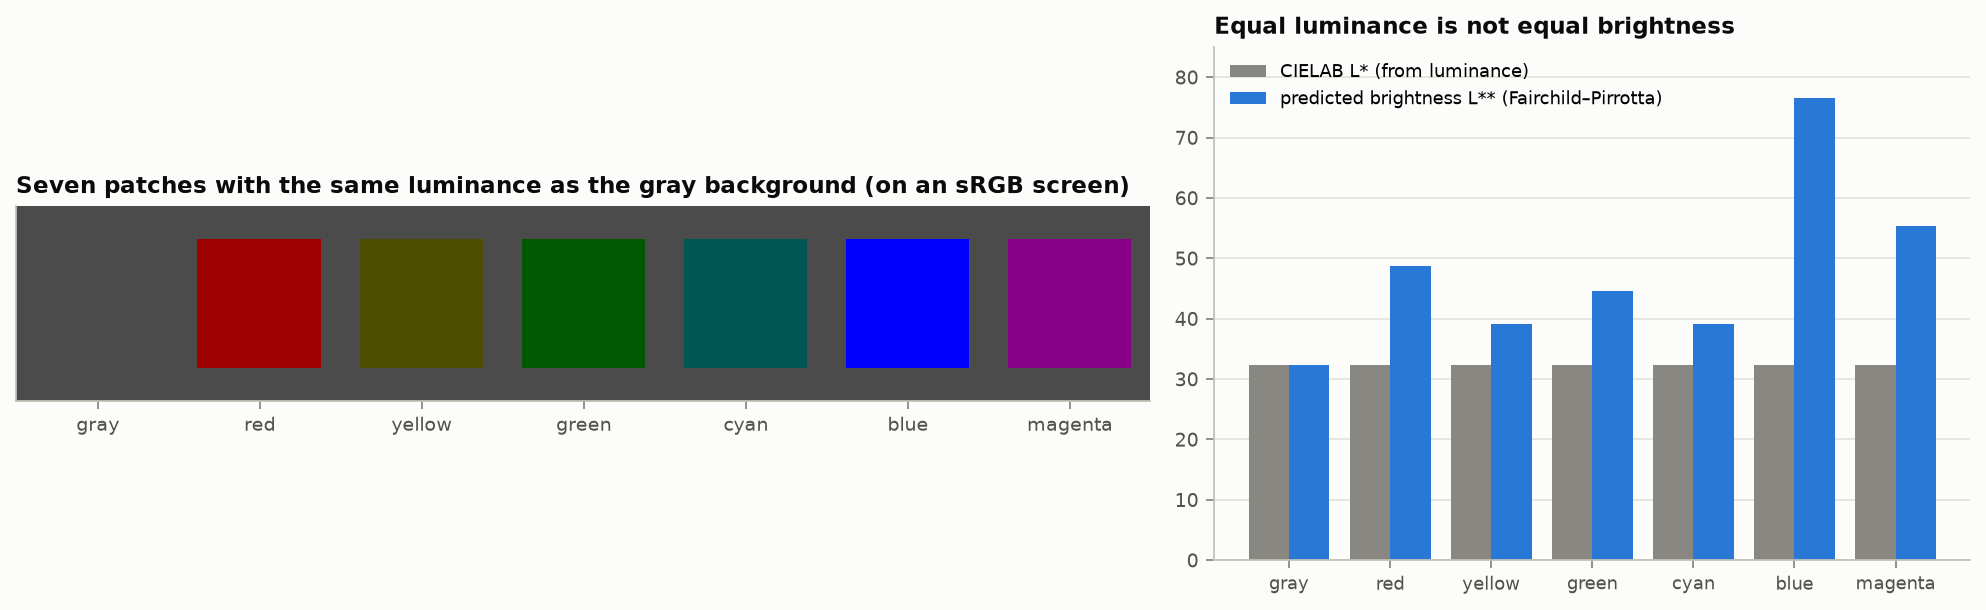
All seven patches have the same measured brightness as the background. The gray one nearly vanishes; the blue and magenta do not.
This matters more every year, because new screens can make very pure colors very bright.
A screen’s colors are a solid, not a triangle
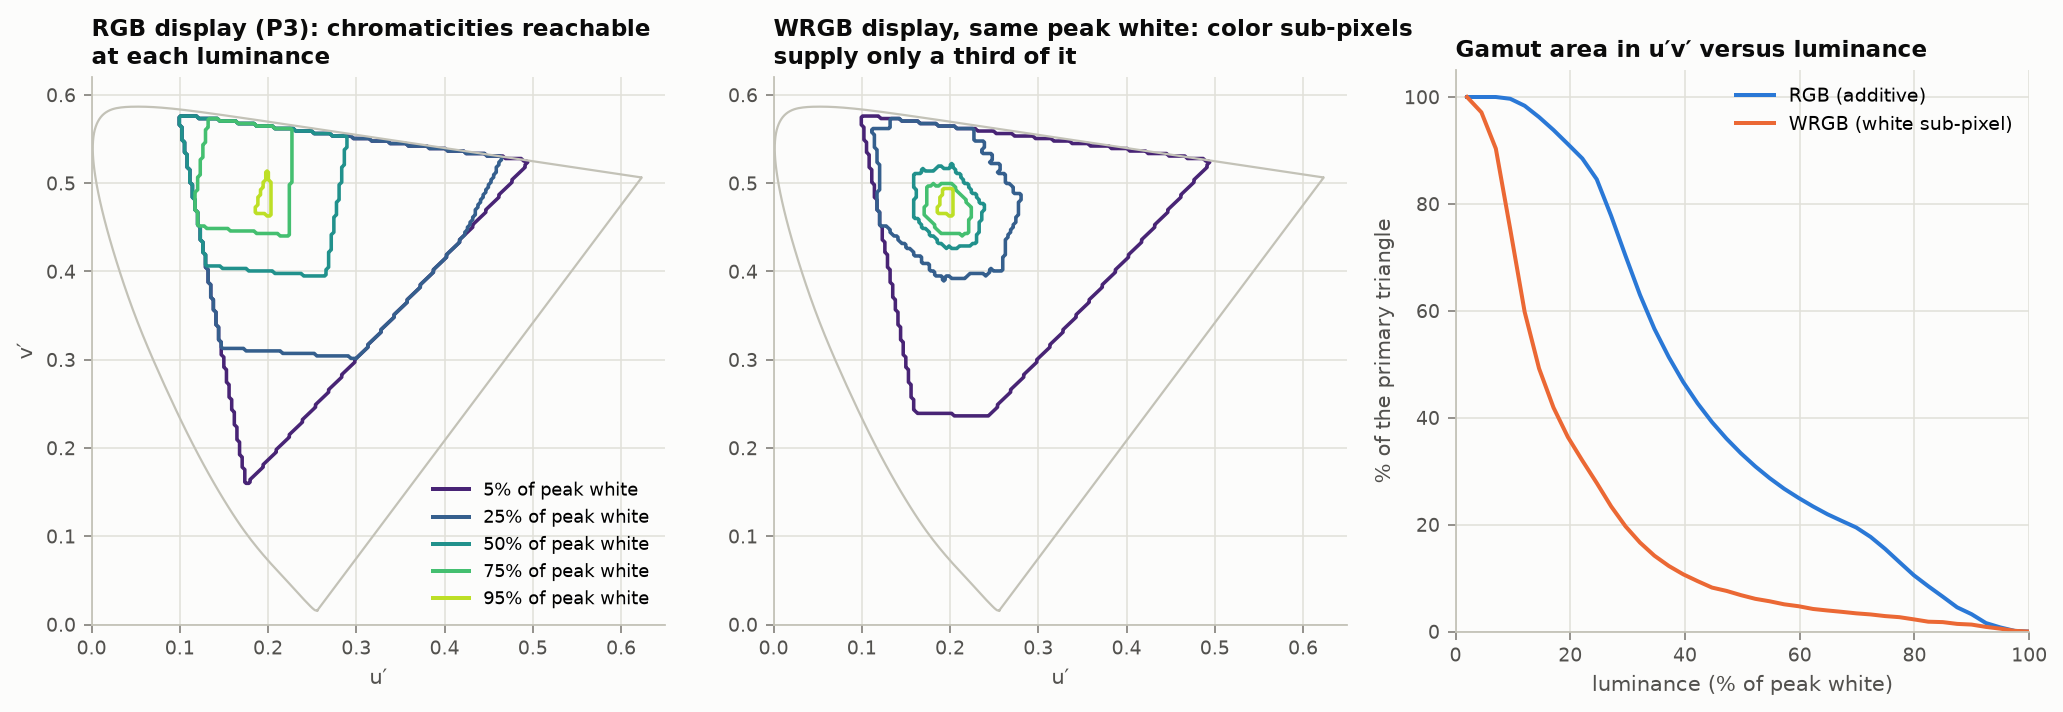
Screen makers show a triangle of the colors a display can make. The triangle is only the base of a solid shape. As brightness goes up, the range of colors shrinks toward white, because a pure red uses only the red light and that light can only get so bright. Screens that add a white sub-pixel to boost brightness lose color even faster.
Your eyes are not the standard eyes
All color measurement rests on an “average observer” defined in 1931 from 17 people. It is known to be off in the blue, and nobody is exactly average. With old screens, whose colors were broad mixtures, this hardly mattered. Laser and LED screens use very pure colors, and for those, two people can look at the same screen and disagree about whether its white matches another screen’s white. Better models of the eye were published in 2006 and 2015, but the industry has not adopted them.
HDR photos that carry two pictures
Phones now save HDR photos as an ordinary picture plus a hidden “gain map” that says how much to brighten each area on an HDR screen. Old software shows the ordinary picture; new software uses both. It is a clever compromise, and it breaks in specific ways:
- Crop, rotate or retouch the photo in an app that does not know about the map, and the map no longer lines up: bright ghosts and halos appear.
- Many websites and messaging apps throw the map away, and the photo quietly becomes ordinary.
- The map is small and coarse, so there are faint halos around very bright objects even in a perfect file.
- The picture looks different as you change your screen brightness, because the amount of boost depends on how much brightness the screen has to spare.
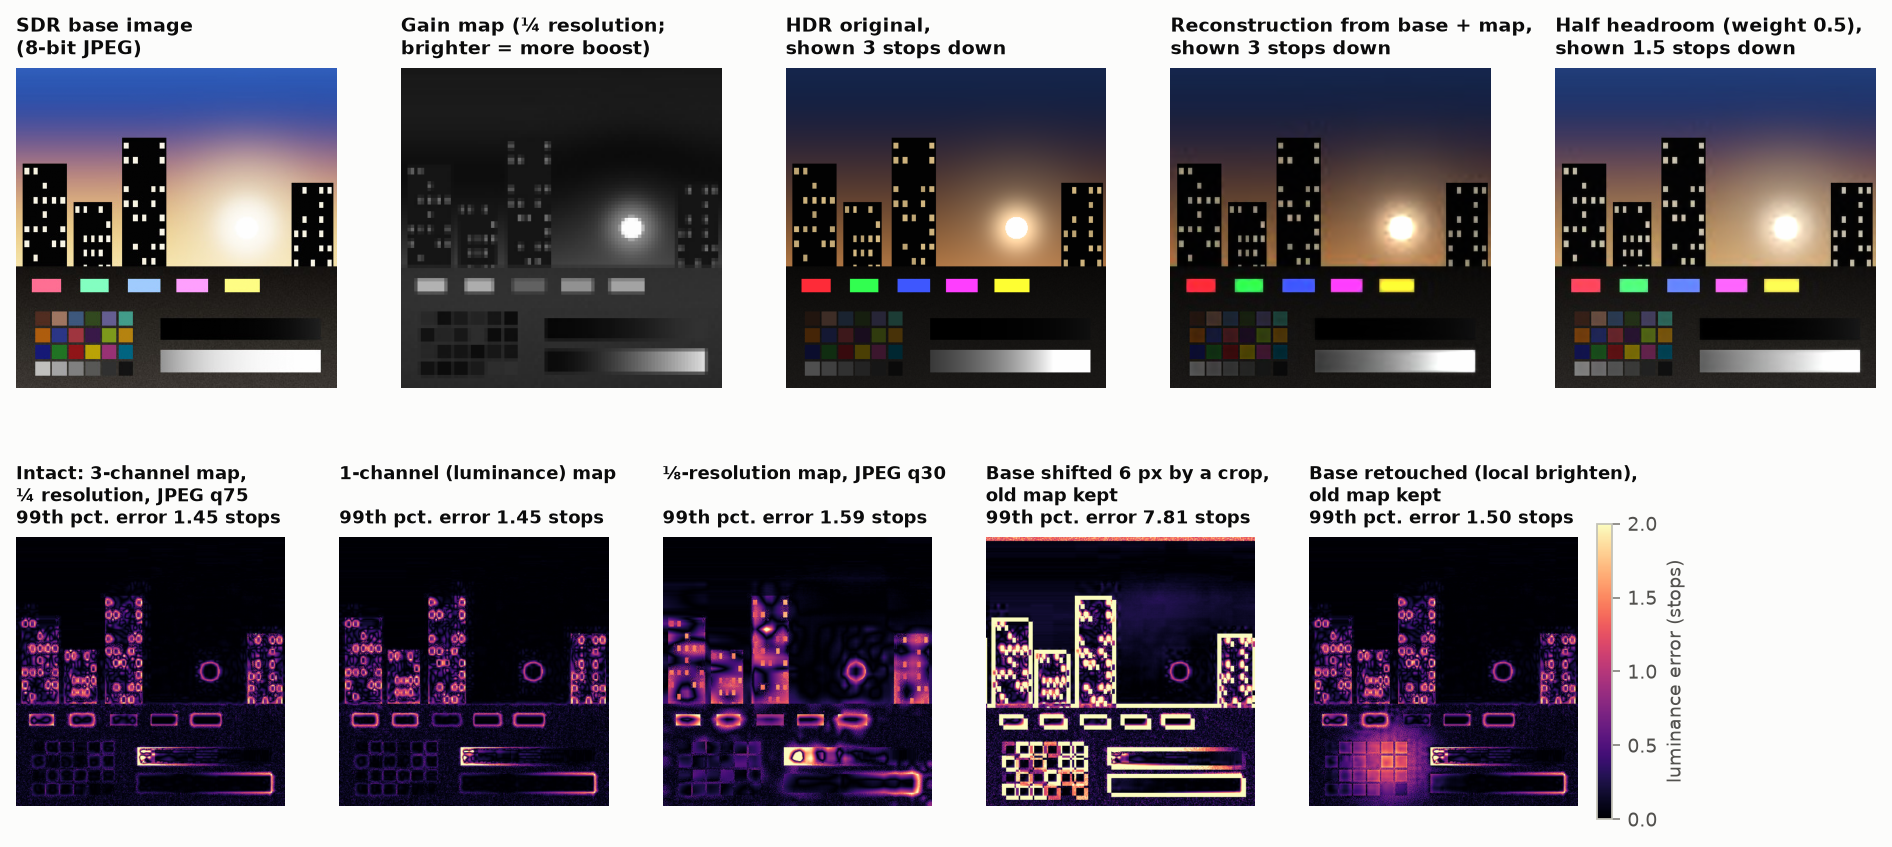
Bottom row: errors in the HDR picture. Fourth panel: after a crop that ignored the gain map.
Where this is going
- Purer colors. TVs with red, green and blue backlights now reach about 90% of the largest standard color range. Lasers reach all of it.
- More than three colors. Research displays use five to seven kinds of light instead of three. The main benefit is not more colors but more agreement between different people’s eyes. No consumer display does this yet. (Cinema projectors sold as “6P” use two sets of three, one for each eye in 3-D.)
- Better number formats. Today’s formats were designed for general computing or for old TVs. Formats designed around what the eye can see could store HDR in fewer bits with less trouble.
- Unsolved problems. There is no agreed way to predict how bright and how colorful something will look at HDR brightness, no agreed way to squeeze a wide range of colors into a narrower one without side effects, and no agreed definition of dynamic range.
Rules of thumb
- Keep the labels with the picture: which colors, which brightness scale, which range.
- Do math on light, not on stored numbers.
- Use more bits than you think you need while working, and add a little noise when reducing them.
- Ask “measured how?” of any claim in stops, nits or percent of a color range.
- Check your whole chain, including the app, browser and operating system at the end.
- After editing an HDR photo, check that it is still HDR and that the highlights still line up.
- Do not expect two different kinds of screen to match perfectly for everyone. They cannot.
Comments